You’re in a rush. Your product demo was due three months ago. And you still don’t have good unit tests. What do you do? You prioritize.
You wrote a very complex piece of machinery with a lot of moving parts. You sorta know how they all fit together in your mind but there isn’t any good know if the program you wrote actually works the way you want it. The solution: unit testing. But how to test and where to start? What do you do? You prioritize.
This post is about how I prioritize what to test. I know how I write my programs, and I write them in a particular way. Feel free to adapt the following to your own process.
Since my program is made mostly of functions, I prioritize my tests by analyzing the function calls of the package/program. Some functions are called many times by different callers, some functions are top functions which calls other functions and outside of the package the top functions are never called. This forms a hierarchy of sorts - some calls are simply more important than others. Since I write mostly in Go nowadays, I’ll use Go as an example. The Go toolchain actually provide us with a lot of useful tools to analyze and prioritize tasks. The most important tool is the callgraph program. This is the invocation of the spell:
callgraph -algo=static -format=graphviz $(go list -tags=release -f '{{.GoFiles}}' | sed -ne 's/\[//p' | sed -ne 's/\]//p') | grep -P '\-\> "(PACKAGENAME|\(\*?PACKAGENAME\.)' | uniq > callgraph.dot
Breakdown
It seems a mouthful, but let’s break it down. We’ll start with this:
callgraph
callgraph -algo=static -format=graphviz
This runs the callgraph program with the static analysis algorithm. It’s the most basic algorithm, as other algorithms require a main package to run. I want callgraph to return a graphviz dot format (for further analyses later). Running the program with just the above will error out because you need to pass in a list of files. This leads us to the next part of the magic:
Passing a List of Files to callgraph
$(go list -tags=release -f='{{.GoFiles}}' | sed -ne 's/\[//p' | sed -ne 's/\]//p')
go list lists all the files for compilation. I specified a build tag of release, and I want go list to return only the filenames. Now, when go list returns the list of files it will look something like this: [a.go b.go c.go]. Passing that into callgraph and callgraph will assume you have a file called "[a.go", and a file called "c.go]" Therefore I pipe the results into sed twice to remove the square brackets. You can also do this at the cost of readability in my opinion:
$(go list -tags=release -f='{{.GoFiles}}' | sed -r -ne 's/(\[|\])//pg')
The 'g' flag indicates that the square braces should be replaced with empty globally. Lastly we wrap everything up in a nice $() to make bash execute and return the results as a literal. We’ve hence successfully passed in a list of files to callgraph.
Filtering the Function Calls
If you call the above alone, you will end up with a huge list of calls. In my simple 5000+ LoC statistical parser it yielded about 17000 calls. That’s no good. We need to reduce the number of calls. Therefore we pipe it into grep and filter the files:
| grep -P '\-\> "(PACKAGENAME|\(\*?PACKAGENAME\.)' | uniq > callgraph.dot
This command pipes into grep that uses the Perl syntax for regular expressions. It basically picks out functions that look like this: ... -> "PACKAGENAME.FUNCTION" or ... -> "(PACKAGENAME.OBJECT).FUNCTIONNAME" This suits my purpose enough. I then uniquify the lines and write it into a file. At this point, the file reads something like this:
"gorgonia.tensorInfo" -> "gorgonia.dtypeToDtype"
"gorgonia.TypeOf" -> "gorgonia.tensorInfo"
"gorgonia.TypeOf" -> "gorgonia.newTensorType"
"gorgonia.TypeOf" -> "gorgonia.DtypeOf"
The Callgraph
The above file is an example of me running callgraph on gorgonia, my library for deep learning in Go. We’ll stick to using that as a running example from now on. From the snippet above, you can read it as gorgonia.tensorInfo calls gorgonia.dtypeToDtype; TypeOf calls tensorInfo, and so on and so forth. But, let’s visualize:  I used gephi to generate the above picture with the Fruchterman-Reingold algorithm since there was a serious bug with the provided graphviz
 sfdp program. I also used gephi because it has built in functions to do some calculations on the graph. Immediately you should notice that some nodes in the graph are more central than others, with more arrows pointing towards them than others. From here on, we have a wide variety of tools to analyze our graph.
Analysis and Priority
I’ll choose the simplest form of analysis. We’ll find the functions that have the most callers to it. Logic dictates the probability of something going wrong will be much higher if it’s used more often by a wider variety of things. So we simply filter the graph to having the highest range of in-degrees. In the case of Gorgonia, I filtered graph for nodes with indegrees greater than 15 (the max indegree was 30). 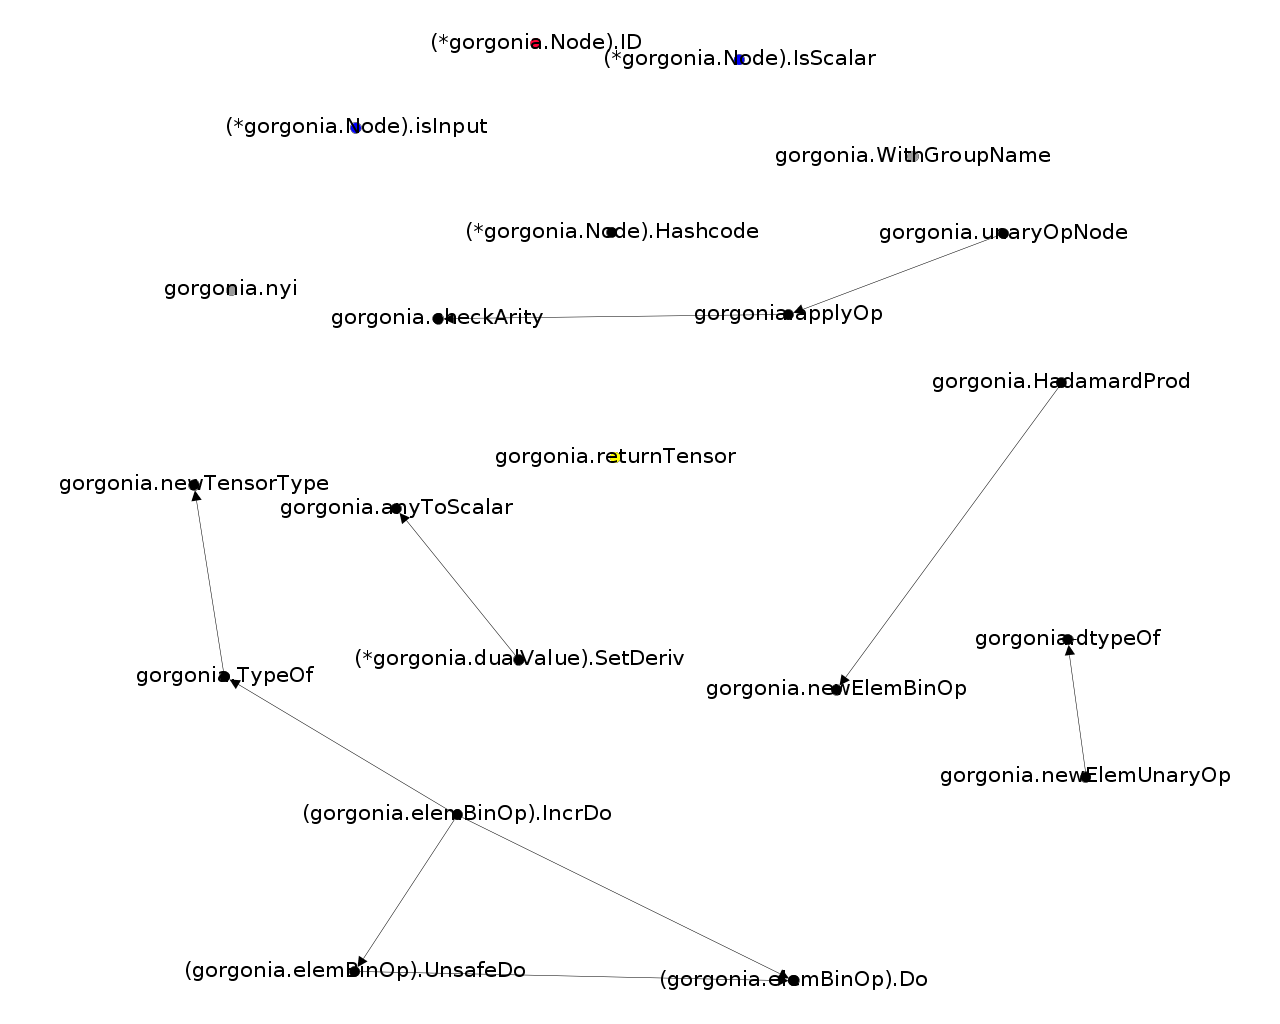 I attempted to colour filter all the nodes by function (for example, blue nodes are attribute checking functions, yellow nodes are performance/pool related functions) but I got lazy. You get the point though. Here we have a number of functions that can serve as a starting point for writing tests. In Gorgonia, each of these functions have nearly 90% test coverage (I should be more diligent to test for errors too though and figure out even more edge cases).
Other Analyses
There are of course, other forms of graph analyses that you can use to prioritize your testing. Here I list a few that I use, with a brief description of the rationale
- Centralities - the more “central” (however you want to measure your centrality - I like to use eignevector centrality) a function/data strucutre is to your program, the more likely it will be a single point of failure. It’s best to get full coverage of those. In Gorgonia, the most central data structure is the
ExprGraphand the methods associated with that data structure. The coverage isn’t as high as I want it to be, and I don’t think I have even covered all the code possibilities. It’s to me a pain point. - Weighted Degrees - Some functions are more important than others - Fact of life. You can use weighted degrees to approximate the importance of functions. The more important a function is, the more vital it is to have tests.
- Clustering Coefficients - The idea is the same as the above. The clustering coefficient measures the cliqueiness of your function calls - basically it’s a good approximate for how tightly coupled your code is. Tightly coupled code is usually a pain in the ass to debug - and I’m no stranger to writing plenty of tightly coupled code. Hence it’s important to also test based on these.
How you prioritize your analysis of course, is very dependent on the goals and motivation of the project. Do you want to make your software more robust? Then handle the more central components of your code first. If your project consists of many many tiny components, it might be a wise idea to use a degree-based analysis.
Conclusion
So there you have it. This is how I prioritize my tests. Now, BRB, I have a bunch of agenda-based learning methods to test.